
Connectivity Project
Reindustrialization in the Age of Fragmentation
by Philip Pilkington
For the full text, please click here!
Policymakers in countries across the developed world are becoming increasingly convinced that Western economies need to explore the possibility of reindustrialization. After the excesses of the New Economy boom of the 1990s, whose ideology claimed that the post-industrial economy was both workable and the ideal, we saw two financial bubbles burst. The first being the Dotcom bubble in equities market which deflated in 2000 and the second being the much more serious housing and mortgage bubble that resulted in the financial crisis of 2008 and the subsequent Great Recession. The economic debates that emerged out of these events has shone a light on the post-industrial economy being a heavily financialized economy that tended to run large trade deficits in many of the major countries. Together with increased geopolitical tensions in the world this has led many to explore the potential for reindustrialization under a variety of names; from ‘reshoring’ to ‘decoupling’.
In this paper we will first examine the rationale behind deindustrialization and then explore what conditions militate in favor of and which militate against reindustrialization. This paper does not seek to provide a blueprint for reindustrialization; that process will look different depending on the country that undertakes it. Here we are more interested in laying out the conditions that, broadly speaking, reindustrialization might require and the broad characteristics that industrialized economies display in contrast to their deindustrialized counterparts. Little thought has so far been given to these conditions and so the following paper aspires to start this debate.
Deindustrialization: Characteristics and Rationalizations
If we scratch the surface, the debates taking place today around decoupling and derisking have deeper roots. For many decades a small but vocal minority of economists and politicians warned about the dangers of the deindustrialization that has taken place in many Western countries since the 1970s. The early debate mainly took place in the United States and focused on the transition of the ‘Steel Belt’ into the ‘Rust Belt’ in the 1970s and 1980s. The Steel Belt was a region in the Northeast and Midwest of the United States that specialized in large-scale, industrial manufacturing that included steelmaking, automobile production, and coal mining. As this region was hollowed out by the forces of globalization, the large factories that once produced goods started to rust giving the region its distinctive, eerie post-industrial look. The Rust Belt has come to signify the process of deindustrialization.
Deindustrialization started to attract attention in the 1990s in America with the rise of political figures like Pat Buchanan and Ross Perot. Despite their message resonating with a large minority of Americans, they were not taken seriously by the political elite. At the time, free market economics had captured the imagination of both Democrats and Republicans in the United States and tearing down trade barriers was seen as the wave of the future. This culminated in the passage of the North American Free Trade Agreement (NAFTA) in 1994 which tore down trade barriers with Canada and Mexico.
The most immediate painful effect of deindustrialization is the loss of highly paid manufacturing jobs. As the following chart shows, manufacturing employment as a percent of total employment in the United States has been falling since the Second World War. But if we look closely, we will see that there are three broad phases of decline.
In the first phase, between 1945 and 1970, the pace of decline was somewhat muted with an average decline of around 1.5% per year. This might be interpreted as the economy moving away from the manufacturing heavy war economy and toward a more balanced consumer-driven economy in which manufacturing continued to play a key role. In the second phase, between 1970 and 2010, we saw a much more rapid decline with an average contraction of around 2.6% per year. This is the period of deindustrialization proper when the Steel Belt turned into the Rust Belt as manufacturing jobs were shipped overseas. Finally, there is the period between 2010 and today. In this period, we see what is left of the manufacturing sector stagnate at low levels. Since 2010 we have only seen manufacturing employment as a percent of total employment contract by around 0.5% per year. In the phase that we are currently living through, deindustrialization has already taken place and we live in a largely deindustrialized economy.

One popular argument amongst those who are strong supporters of free trade is that deindustrialization is a natural process. These proponents claim that the decline in manufacturing jobs is purely due to advances in technological development. More of manufacturing is automated, they argue, and so we need less employees in this sector. There is certainly some truth to this argument. Some manufacturing jobs have no doubt been made redundant by gains in technological development.

While technological development may explain some deindustrialization, it does not explain all deindustrialization. We can see this clearly if we compare Western countries’ manufacturing output as a share of world manufacturing output with that of the BRICS. In the Western grouping we include all the major Western economies: the European Union, Japan, South Korea, the United States and Canada. As we can see, Western manufacturing has been declining as the BRICS has been rising. This is clear evidence that the drain of manufacturing jobs from the Western countries is not simply due to technological developments. At least some component of this decline is due to a redistribution of manufacturing jobs from Western countries to the BRICS countries. One of the main drivers of this is because the BRICS countries have substantially lower labor costs than the Western countries, making them more profitable places to produce goods.
Wages and Competitiveness
The best way to approach the question of whether reindustrialization is possible in today’s interconnected world is to start with compensation or wage rates. It seems intuitively plausible that one of the biggest drivers of the shifts in global industry that we have seen in the past decades is wages. When a company decides where to undertake its manufacturing, it is sensitive to costs. Since wages are the largest cost for a manufacturing company, it therefore follows that one of their top priorities should be to minimize the wage bill. This is not to say that companies will simply go to the country with the lowest wage bill. If this were true, manufacturing companies would be setting up shop in sub-Saharan Africa where wages are extremely low. Obviously, there are other requirements, including infrastructure and relatively high education levels. But once we assume there are countries that can compete on infrastructure and education it seems reasonable to think that wages will be a strong motivating factor.
The following chart shows daily income rates in US dollars for our Western grouping countries. As we can see, the wage rates are extremely variable. Even within the Western grouping there is a very wide divergence in daily income rates, and therefore in wage rates. This is useful because it will allow us to test to what extent these wage rates drive outcomes. Having such a large and diverse sample gives us confidence that analysis should show clearly if and to what extent wage rates impact a variety of variables related to industrialization.

First, we should be clear about what this chart does and does not show. It is not a chart showing relative wealth levels of the countries listed. This is because it is not adjusted for purchasing power parity (PPP), that is, for relative price levels in the countries in question. Take Hungary as an example. According to the average daily income level, in 2022 the average Hungarian earns only 31% what the average American earns. But if we take PPP-adjusted per capita income (a very similar measure), we find that the average Hungarian earns 54% what the average American earns, which seems far more sensible if we are familiar with the economies of the two countries.
What this chart can measure is competitiveness on a purely cost basis. When an international company is looking to invest in a country, assuming that their business activity is based in dollars or euros, all they see is the price of labor. That is, the nominal dollar/euro wage. So, while the average Hungarian worker may earn about 54% of what the American worker earns, the cost of employing the worker is only 31% the cost of employing an American worker[1]. We would expect countries that are the most competitive on a cost basis, namely Romania, Poland, Slovakia, and Hungary, to be the best positioned to undergo reindustrialization. Paradoxically, in a world concerned with reindustrialization it is the countries that are lagging that have the built-in cost advantage. Mature economies will need to reindustrialize despite high wages.
Next, we look at the daily income rates in the BRICS countries. These show extremely interesting dynamics. The first thing that stands out is the rapid rise of Chinese daily income. This contrasts with India, where daily income has barely grown in the past 30 years. It is also interesting that Brazilian daily income has fallen dramatically since 2019, at least in US dollar terms. Daily income in these countries tends to grow rapidly as they catch up with the West, but this is by no means uniform. Nor does it appear to be uninterrupted in every country.

Investment, Foreign and Domestic
To reindustrialize an economy, increasing the rate of investment is crucial, and so it is important to understand potential impediments to investment. The first variable we will look at is Foreign Direct Investment (FDI). We have learned from decades of globalization that when countries industrialize, they often do so based on foreign investment. This makes sense because foreign companies often have both the capital and the knowledge that domestic players lack, while the country itself is attractive to foreign investment based on a variety of factors, one of which is the relative wage rate. In theory, then, wages should be a key determinate of FDI. Countries with lower wage rates should attract more FDI than countries with higher wage rates. The following chart shows the 2017-2022 average of FDI as a percentage of GDP for all the countries in our sample.

What immediately stands out is how low FDI inflows into the BRICS countries are relative to some of the Western countries[2]. This is surprising because the conventional wisdom is that countries that are developing – and especially those countries that are developing and growing relatively rapidly – attract a lot of FDI. But this is clearly not the case. This chart also shows why recent articles highlighting the drying up of foreign investment into China in 2023[3] are misguided: Chinese development was never significantly reliant on FDI. Indeed, this chart suggests that it is foreign investors who stand the most to gain out of investment in rapidly growing emerging economies, not the economies themselves, many of which seem able to grow without these inflows.
Next, we will see if there is a relationship between average income in a country and FDI inflows.

Overall, the relationship between average income and FDI is very weak, in both the Western countries and in the BRICS. The weak relationship between the variables in the Western countries shown in blue is mainly driven by the two outliers: Hungary and the Netherlands. If we remove these from the regression, we see the relationship break down completely and the fall to 0.0389. It is surprising that average income does not correlate with FDI, as we might think that a main driver of FDI is low labour costs. But the data shows that other factors must override this consideration. This does not mean that having low labour costs is not one variable influencing FDI inflows – logic and experience would suggest that they are – but the data shows that low labour costs alone are not enough to attract FDI, nor are high labour costs enough to repel it.
Next, we will look at gross fixed capital formation as a percent of GDP. Gross fixed capital investment shows us the total amount of investment taking place in an economy at any given moment in time. Measuring this as a percentage of GDP tells us how much of a country’s national income is being allocated to investment, which in turn determines how quickly the economy will grow in the future.

Here we see precisely the opposite of what we saw when we examined FDI[4]. While FDI in the rapidly developing BRICS countries was quite low relative to many Western countries, gross fixed capital formation is somewhat higher – although if we look at China, which is by far the largest economy, we might say that it is very high. What this tells us is that developing countries mainly rely for their capital development on internal capital accumulation while Western countries typically seek out a combination of domestic and foreign capital to build their capital stock.
Next, we will look at whether gross fixed capital formation is impacted by average income levels.

As we can see, there is no discernible relationship between income levels and gross fixed capital formation. As with the lack of relationship between average income and FDI, this is somewhat surprising as intuitively we would expect there to be a relationship. After all, an economy that has more of its GDP allocated to investment logically speaking has less of its GDP allocated to consumption. If less GDP is allocated to wages and consumption, then more will be allocated to profits which is the key source of investment in an economy. We would therefore expect a country with lower average income levels to have higher rates of investment, but this is not what we see.
Manufacturing and Trade
Next, we will broaden our analysis beyond simple investment metrics. In what follows we will examine various relationships that involve the size of manufacturing relative to the entire economy and the current account balance. Until now, we have purely been focused on investment. Investment would be the path to reindustrialization for any economy that wishes to do so, but investment can flow into the services sector. Focusing on the manufacturing sector will give us a direct reading on what might prove an impediment to reindustrialization.
Meanwhile, examining the current account is important because the reason that many economists are calling for reindustrialization is because deindustrialization has resulted in large trade deficits. It is therefore crucial to better understand the relationship between the current account balance and a variety of other variables. Let us start with manufacturing.

Looking at this chart we see that the average BRICS country has a higher share of manufacturing as a percentage of GDP than the average Western country. Nevertheless, there is a wide dispersion within both groups. Putting aside the numbers for Ireland because they are very likely misleading[5], no country Western or BRICS is larger than China. The only country that really competes with China in this regard is South Korea. This is interesting because South Korea is a wealthy country with a PPP-adjusted per capita GDP of $56,709 in 2023, or around 70% of the United States. This suggests that manufacturing is not simply determined by having access to low wage workers.
Next let us look at the current account balance.
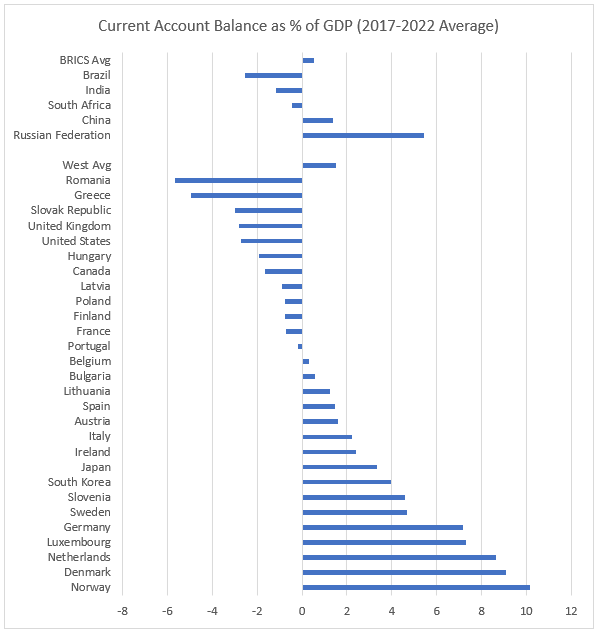
Here we see a very wide dispersion in both groups, and especially within the Western grouping. This immediately suggests that the Western grouping is severely imbalanced, even within itself. The current account surpluses run by countries like Norway and Germany are obviously requiring deficits being run elsewhere. While it is true that a good deal of the imbalances amongst the Western current account deficit countries are due to trade with BRICS countries, especially China, this does not account for all the imbalances. It is worth nothing, however, that because this data takes a 2017-2022 average it does not account for the pressure being put on the current account balances of European countries due to the structural rise in energy prices since the summer of 2022[6]. This is worth keeping in mind moving forward.
Now, we will test the impact of average daily income on manufacturing and the current account balance.

Here we see that average daily income bears no relationship to manufacturing as a percent of GDP. This suggests that having a low wage economy is neither a necessary nor a sufficient condition for having a large manufacturing component in a country’s economy. There does appear, however, to be a consistent relationship in both the Western economies and in the BRICS between running a current account surplus and having a higher average daily income. This is a very interesting finding as one economic model might suggest that having a low wage economy might allow a country to be more competitive and run a current account surplus. But, in fact, the opposite is the case. It seems likely that the causality here is the reverse: having a globally competitive economy that can run a trade surplus gives rise to higher living standards.
It is worth highlighting the situation of the United States in this regard as it seems somewhat of an outlier. In the top left of the chart is the United States, which we have highlighted by marking it as a triangle rather than a circle. As we can see, the United States runs a substantial current account deficit – close to 3% of GDP. Yet the United States also has one of the highest average incomes in our whole sample. What this tells us is that the United States may have too high an average income relative to its international competitiveness. This is likely an effect of the US dollar being the global reserve currency, and this suggests that if the dollar were ever to lose its reserve currency status, the United States may see a substantial contracting in its living standards. This is an extremely interesting finding and we have done some further modelling in this direction in the appendix at the end of this paper.
Next, we will test manufacturing and the current account against one another. This in effect asks whether having a robust manufacturing sector predicts that a country might run a current account surplus.

Interestingly, this is not the case. Having a large manufacturing sector does not predict running a current account surplus. This is an interesting finding as it tells us that a country can aspire to running a balanced current account or even a surplus without having to reindustrialize. We should note, however, that although having a large manufacturing sector does not predict a country running a current account surplus, every country in our sample with a manufacturing sector that is above 20% of GDP runs a current account surplus. So, while having a large manufacturing sector may not be a necessary condition to run a current account surplus, our data suggests it may be a sufficient condition.
Next, we will examine the impact of FDI on both the current account balance and a country’s manufacturing sector.
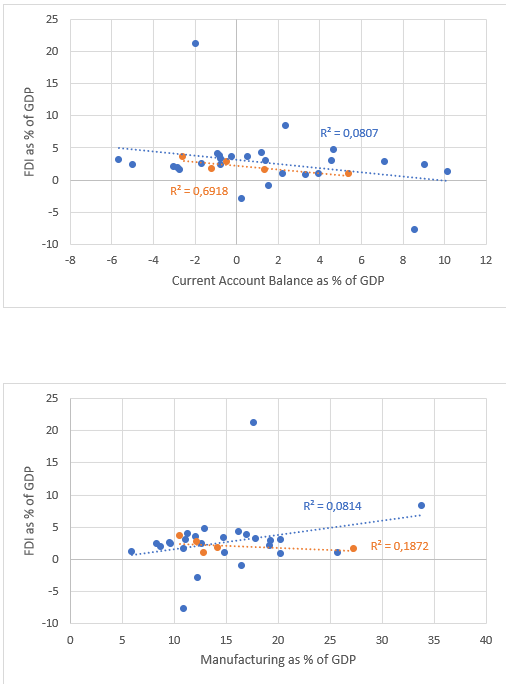
Here we see that amongst Western countries FDI is not predictive of either having a large manufacturing sector or running a current account surplus or deficit. It is worth now highlighting that FDI does not seem to have any macroeconomic effects in Western countries, at least with respect to the variables that we have examined. Yet we do see some relationship between FDI and the variables we are studying in the BRICS countries. We see a strong relationship between the amount of FDI a country has and that country running a trade deficit. This is likely due to inward FDI flows into developing countries allowing those countries to finance larger current account deficits. Whether this is a positive or a negative relationship depends on if those countries are using this ability to run trade deficits to invest in and develop their country, or whether they are simply using it to boost consumption. We see a much weaker relationship between manufacturing and FDI, with lower FDI inflows predicting a higher manufacturing sector. Since this relationship is weak and makes no intuitive sense, this seems likely to be a spurious correlation.
Finally, we will examine the relationship between gross fixed capital formation, manufacturing, and the current account.
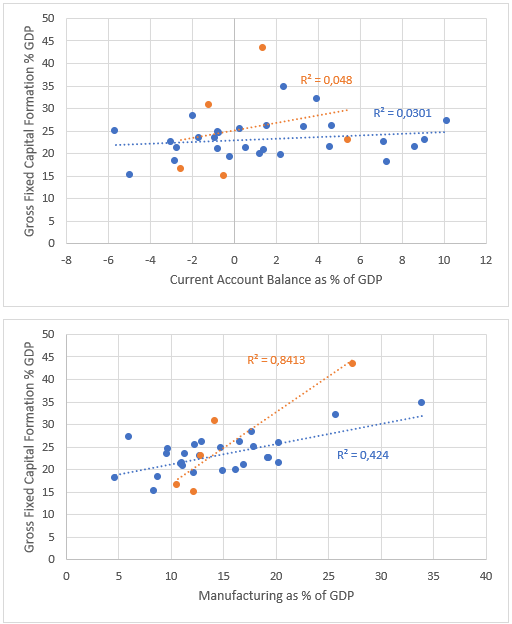
Here we see no relationship between gross fixed capital formation and a country’s current account. But we find a strong, consistent relationship between gross fixed capital formation and the size of a country’s manufacturing sector. Having a large manufacturing sector is strongly associated with having a large share of the economy devoted to investment. This seems like further confirmation of Kaldor’s Growth Laws – named after the British-Hungarian economist Nicholas Kaldor – which states that there is a strong relationship between the manufacturing share of an economy and the potential productivity growth of that economy. This result suggests that having a largely services-based economy strongly predicts low investment in that economy. This is a very important lesson in a world where many countries – mostly those with small manufacturing sectors – are experiencing stagnant or low productivity growth.
Conclusion
The debates taking place today around ‘decoupling,’ ‘derisking’ and ‘reshoring’ have deep roots. A small but vocal minority of economists and politicians have warned about the dangers of deindustrialization for many decades, but they were not taken seriously by the political elite. As a result, we now live in a largely deindustrialized economy. The process of deindustrialization was not a natural one. Some manufacturing jobs have no doubt been made redundant by gains in technological development, but at least some component of the decline was due to a redistribution of manufacturing jobs from Western countries to the BRICS countries – especially China – a shift driven in part by lower labor costs.
When looking at the data, however, we found that that having a low wage economy is neither a necessary nor a sufficient condition for having a large manufacturing sector in a country’s economy today. High labor costs are not impossible to marry with high levels of investment and industrialization – as countries like Japan and Germany have shown – but they likely do not make industrialization any easier. For this reason, Western countries that still have relatively lower wages have a distinct advantage in the race to accumulate industrial power. This is encouraging. It does appear to be possible for the Western countries to largely maintain their living standards intact and try to promote much higher rates of investment. Although this would likely require higher domestic saving rates and, most importantly, a concerted effort on the part of government to channel savings into productive investment rather than blowing bubbles in the financial markets.
Many economists are calling for reindustrialization as a way of dealing with the trade deficits created by deindustrialization. The results of this paper confirm that while having a large manufacturing sector is not necessary for running a current account surplus, a large manufacturing sector may be a sufficient condition. A country can aspire to running a balanced current account or even a surplus without having to reindustrialize, but reindustrialization seems to be a reliable method to accomplish such aspirations.
In summary, reindustrialization has clear merits. A large manufacturing sector means that much of the economy is devoted to investment, which means that there is a large potential for economic growth. A large manufacturing sector also seems sufficient for running a current account surplus. If countries with stagnant or low productivity growth want to solve their problems, they would be well advised to reindustrialize their economies. Indeed, if the recent debates about industry are to have a positive impact we need to have a real discussion on the necessary link between manufacturing, productivity growth, and economic growth. This was once a well-known empirical relationship[7] but due to the popularity of narratives about globalization and a supposed ‘new economy’ driven by the service sector, this relationship appears to have been forgotten.
Reindustrialization will be no easy task, however. We have shown in this paper that very deep changes have taken place in the world economy over the past 30 years. Reindustrializing an economy is not like flicking on a light switch – and when the data is examined carefully it becomes clear that some of the advocates for protectionism are likely far too optimistic in their assessments. Overall, the data suggests that reindustrialization is possible if economies focus on very high rates of internal investment – something that will require well-organized industrial policy to achieve – but we should not expect miracles. If Western countries are serious about reindustrializing their economies, they should stop looking for quick-fix solutions – especially those that lead to dangerous levels of global conflict around trade flows – and instead focus on developing a multi-decade plan to massive boost investment in the West. We hope that some of the basic relationships that we have revealed in our work provide some initial hints at how this might be achieved.
Appendix: America After the Decline of the Global Dollar
One of the more interesting, and unexpected, findings we came across in our work is that the United States is an extreme outlier when it comes to the relationship between its current account deficit and its income level. We found that in general there is a robust relationship between the current account balance and the income level of a country. This relationship held for both BRICS countries and developed countries. This finding confirms the fact that there is a strong case to be made that income levels are at least in part determined by a country’s capacity to grow its exports in line with its GDP – a relationship known in the literature as ‘balance of payments constrained growth’[8].
Why then does the United States stand out as a rather extreme outlier? We would posit that this is due to the unique status of the American dollar. It is well-known intuitively that the US dollar holds a privileged place in the world economy: that of the global reserve currency. It is also well-known that this grants the United States what has been referred to as an “exorbitant privilege” in that it allows the country to run trade deficits with other countries – especially China and Japan – that are financed by simply sending these countries dollars that can be recycled either into American financial markets or into American government debt. It seems highly likely that this is the relationship that we are seeing in our regression chart when the United States appears as an extreme outlier.
If this is the correct interpretation, it gives us an opportunity to model what the United States economy might look like in a world where the US dollar is no longer the global reserve currency. This is important because there is increasing evidence that, in the wake of the Ukraine war and the American seizure of Russian foreign exchange reserves, many countries are preparing to move away from the dollar[9].
Currently, the average daily income of the United States is just over $74 despite its current account deficit of around 2.7% of GDP. The only country that compares to this is Luxembourg, but Luxembourg is a small, unusual economy – and one that runs a current account surplus of over 7% of GDP. Norway is somewhat comparable, with an average daily income of over $67 but Norway has enormous oil reserves relative to the size of its economy and runs a current account surplus of over 10% of GDP. In what follows we will allow American living standards to fall to their equilibrium level when we allow the impact of the current account to have its impact – that is, if we assume that the US dollar loses its ‘exorbitant privilege’.

As the graph above shows, if we allow American living standards to fall to their full equilibrium level, they fall by around 57%. This is a truly enormous decline and we do not think that it is likely. If we look at the regression, we see that richer countries with daily income levels above $40 or so seem to sit higher than the overall regression line. Intuitively this suggests that wealthier countries are better able to sustain higher living standards than poorer countries relative to their current account balance. We can consider this ‘premium’ if we calibrate the model not on the entire sample but rather on the wealthier countries. Doing this shows a decline in American living standards of around 27% if the country was forced to equilibrium by a decline in the US dollar as the global reserve currency.
This seems a more sensible model than the 57% decline we saw using the full model in that it drags American living standards down to roughly average European levels. This is interesting. In recent years it has become fashionable to point out that, while European living standards have been largely stagnant, America’s have been expanding[10]. What our work suggests this is not due to America’s superior economic productivity. Rather it is a direct effect of the United States possessing the global reserve currency. As the dollar declines as the global reserve currency, we would expect the country to adapt to more standard European levels of living standards. The likely route to this decline in living standards will be a long-term decline in the value of the US dollar and a rise in import prices in the United States.
[1] To fully measure international competitiveness, we must also consider relative worker productivity, that is, the amount of output produced per worker. Combining this with earnings data we can construct what is called an index of Unit Labor Costs (ULCs). ULCs are the standard way of measuring international competitiveness. We have not used ULCs here for two main reasons. First, ULCs are very difficult to compare internationally in any given year or time period. This is because they are indices, not absolute measures and so any comparison is tainted by which base year is chosen. Secondly, we simply do not have good productivity data for many of the BRICS countries and since our main goal is to consider reindustrialization considering the emergence of the BRICS, excluding them because they had insufficient data would make the study impossible. Overall, we think that nominal wage costs are a good enough metric for comparison, as these are largely what actual companies doing investment look at when considering whether to invest in a country or region.
[2] Note that we have excluded Luxembourg from both the Western average in this chart and the subsequent analysis regarding FDI flows. Due to its unusual status as a banking hub, FDI inflows/outflows into Luxembourg are too large and volatile to make sense of. For example, in 2022 FDI flowing into Luxembourg was -394% of GDP while in 2019 it was 234% of GDP. Clearly these are not ‘real’ FDI flows but are due to some sort of financial engineering or tax efficiency game.
[3] For example, see: https://www.piie.com/blogs/realtime-economics/foreign-direct-investment-exiting-china-new-data-show
[4] We should note that on multiple investment related metrics, Irish data is not trustworthy. This is because the country artificially books R&D as taking place in Ireland when it is not so that multinational corporations can engage in tax efficiency practices. The Central Statistics Office (CSO) in Ireland has remedied this problem when it comes to measuring the overall GDP of the country with its ‘modified GNI’ metric, but it have not yet adjusted many other investment-oriented metrics. We debated whether to include Ireland in the analysis, but since we found that it makes little difference to the results, we left the country in. Nevertheless, the Irish figures should be viewed with suspicion. This is not to say that Ireland does not have substantial fixed capital formation and a large manufacturing sector – it does – but the figures exaggerate both.
[5] Irish figures should not be taken at face value because between 2014 and 2015 Irish manufacturing increased from 19.7% of GDP to 34.8% of GDP. It is impossible that Ireland saw such a dramatic expansion of its manufacturing sector in a single year and therefore the increase is probably due to accounting tricks associated with tax efficiency strategies pursued by multinational companies. We have left the Irish data in the chart because it is the official data, but it is more likely that Ireland has a manufacturing sector that is close to 20% of GDP – a substantial sector close in relative size to Germany and Japan, but not record-breaking as the official statistics show.
[6] Of course, shifts in the global energy markets in the face of the war in Ukraine are some of the most important trends moving forward when it comes to deindustrialization/reindustrialization. But this paper is not focused on the impact of the new structure of the global energy market in various countries’ industrial bases – this would be a topic for a separate paper. Here we try and abstract from this issue and look at the underlying issues before energy became so important. This is an analytical device and in no way tries to discount the impact of energy costs on the future courses various countries will follow in terms of their industry.
[7] Thirlwall, A. P. (1983). “A Plain Man’s Guide to Kaldor’s Growth Laws”. Journal of Post Keynesian Economics. 5 (3): 345–358.
[8] Thirlwall, A. P. (2012). “Balance of Payments Constrained Growth Models: History and Overview”. Models of Balance of Payments Constrained Growth. Palgrave Macmillan.
[9] Pilkington, P. (2022). ‘The End of Dollar Hegemony?’. American Affairs. https://americanaffairsjournal.org/2022/03/the-end-of-dollar-hegemony/
[10] See, for example:
Leparmentier, A. (2023). ‘The GDP Gap Between Europe and the United States is Now 80%’. Le Monde, September 4th 2023.

